What 19 months of daily downloads say about the Hugging Face Hub
Every model page on the Hub shows one number: downloads in the last 30 days. It's useful, but it's a snapshot. It can't tell you whether a model is growing or fading, how it compares with its peers, or how much of its reach comes from the quantizations and fine-tunes built on top of it.
So I rebuilt the history. Model Pulse reads every daily revision of @cfahlgren1's hub-stats dataset, back to July 2024, and turns them into a day-by-day series for 1.6 million models. Since February 2025 those snapshots include all-time totals, which makes exact daily downloads possible: 19 months of them, for every model that anyone actually uses.
This post walks through what that data shows. Every number comes from the open dataset, and every model mentioned can be looked up on Model Pulse.
The short version
- The Hub serves about 100 million model downloads a day, up from about 62 million a year ago.
- Rerankers grew almost 10x and vision-language models more than 6x in that year. BERT-style fill-mask models are the only big category that shrank.
- Qwen's own repos take 54% of all text and vision-language model downloads. Meta's took about a quarter in March 2025 and take 5% now.
- 43% of all downloads go to derivatives, up from 18%. Quantizations alone went from 9% to 28%.
- Unsloth grew 6x and LM Studio's community org 24x, making the quantizers some of the biggest publishers on the Hub.
- The top of the Hub is losing its grip: the ten most downloaded models took 34% of downloads in March 2025 and 22% now.
- The typical downloaded LLM nearly doubled in size, from 3.0B to 5.7B parameters.
- Old models still carry the Hub: 10 of the 15 most downloaded models are dated 2022 or earlier.
- A launch spikes for two weeks and then plateaus. 43% of successful launches had their best week after their third month.
- Likes measure excitement, not use. Image models collect 160 times more likes per download than rerankers.
1. The Hub serves about 100 million model downloads a day
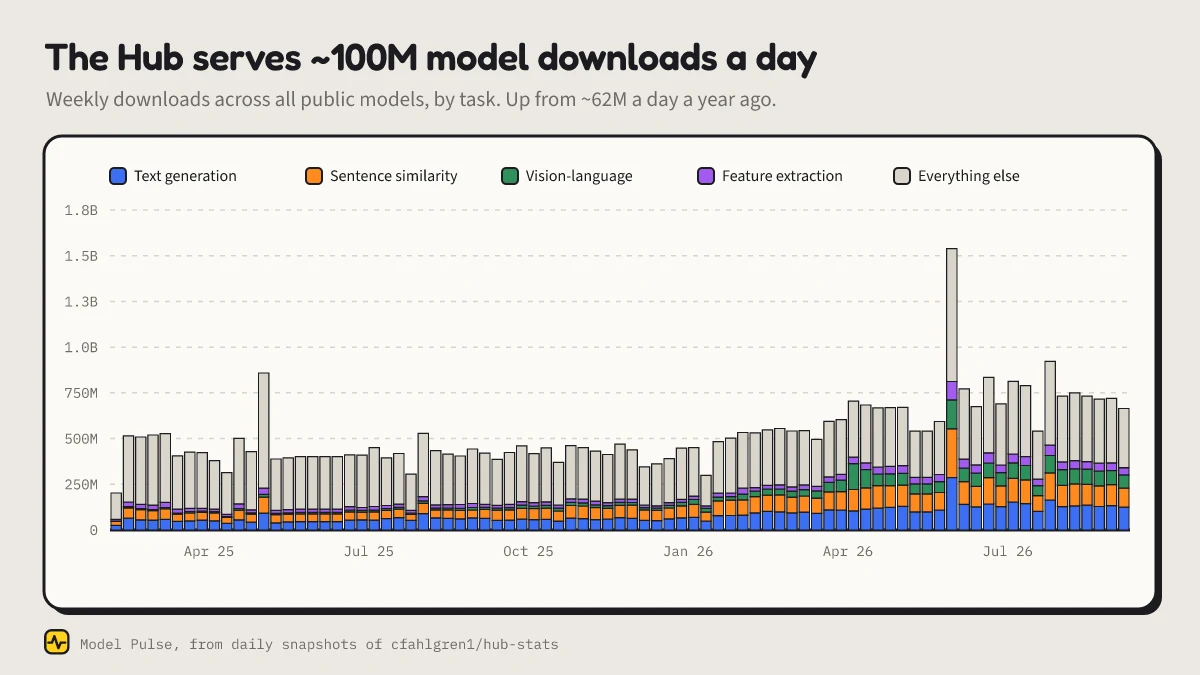
In September 2026 public models were downloaded about 100M times on a typical day, against about 62M a year earlier. The growth wasn't spread evenly across tasks:
| Task | Sep 2025, per day | Sep 2026, per day | Change |
|---|---|---|---|
| Text generation | 9.0M | 18.0M | 2.0x |
| Sentence similarity | 6.7M | 16.2M | 2.4x |
| Vision-language (image-text-to-text) | 1.6M | 10.7M | 6.6x |
| Feature extraction | 2.8M | 5.9M | 2.2x |
| Automatic speech recognition | 2.4M | 4.8M | 2.0x |
| Fill-mask | 5.5M | 4.6M | 0.8x |
| Text ranking (rerankers) | 0.4M | 3.9M | 9.7x |
| Everything else | 31.8M | 34.7M | 1.1x |
Two things stand out. Rerankers went from a niche to nearly 4M downloads a day, which is what you'd expect as retrieval pipelines add a reranking step. And fill-mask, the task behind the original BERT wave, is the only large category that shrank.
The spike in late June 2026 is a reminder of how the Hub counts: it sometimes books delayed downloads on a single day. Weekly totals smooth most of that out.
2. Embeddings and retrieval quietly run the Hub
Generative models get the attention, but the most downloaded models on the Hub are small encoders. These were the top 15 in September 2026:
| Model | Created | Downloads in September 2026 |
|---|---|---|
| sentence-transformers/all-MiniLM-L6-v2 | 2022 or earlier | 252.4M |
| cross-encoder/ms-marco-MiniLM-L6-v2 | 2022 or earlier | 89.6M |
| BAAI/bge-small-en-v1.5 | 2023 | 65.8M |
| sentence-transformers/paraphrase-multilingual-MiniLM-L12-v2 | 2022 or earlier | 50.0M |
| google/electra-base-discriminator | 2022 or earlier | 48.5M |
| google-bert/bert-base-uncased | 2022 or earlier | 42.6M |
| BAAI/bge-m3 | 2024 | 37.2M |
| Qwen/Qwen3-0.6B | 2025 | 30.6M |
| google-t5/t5-small | 2022 or earlier | 25.2M |
| amazon/chronos-2 | 2025 | 23.5M |
| Comfy-Org/MiniMax-H3 | 2026 | 22.8M |
| openai/clip-vit-base-patch32 | 2022 or earlier | 22.3M |
| timm/mobilenetv3_small_100.lamb_in1k | 2022 or earlier | 21.6M |
| sentence-transformers/all-mpnet-base-v2 | 2022 or earlier | 21.3M |
| FacebookAI/xlm-roberta-base | 2022 or earlier | 17.7M |
From April to September 2026 the sentence-transformers organization served 2.27B downloads, slightly more than Qwen's 2.16B. The sentence-transformers library went from 13% of all downloads to 27%, while transformers went from 71% to 56%:
| Library | Mar 2025 | Sep 2026 |
|---|---|---|
| transformers | 70.9% | 55.5% |
| sentence-transformers | 13.2% | 26.8% |
| no library tag | 3.8% | 8.5% |
| timm | 5.5% | 1.8% |
| diffusers | 2.9% | 1.8% |
| gguf | 0.0% | 1.7% |
| mlx | 0.0% | 0.7% |
| transformers.js | 0.2% | 0.6% |
3. Qwen gets half of all LLM downloads
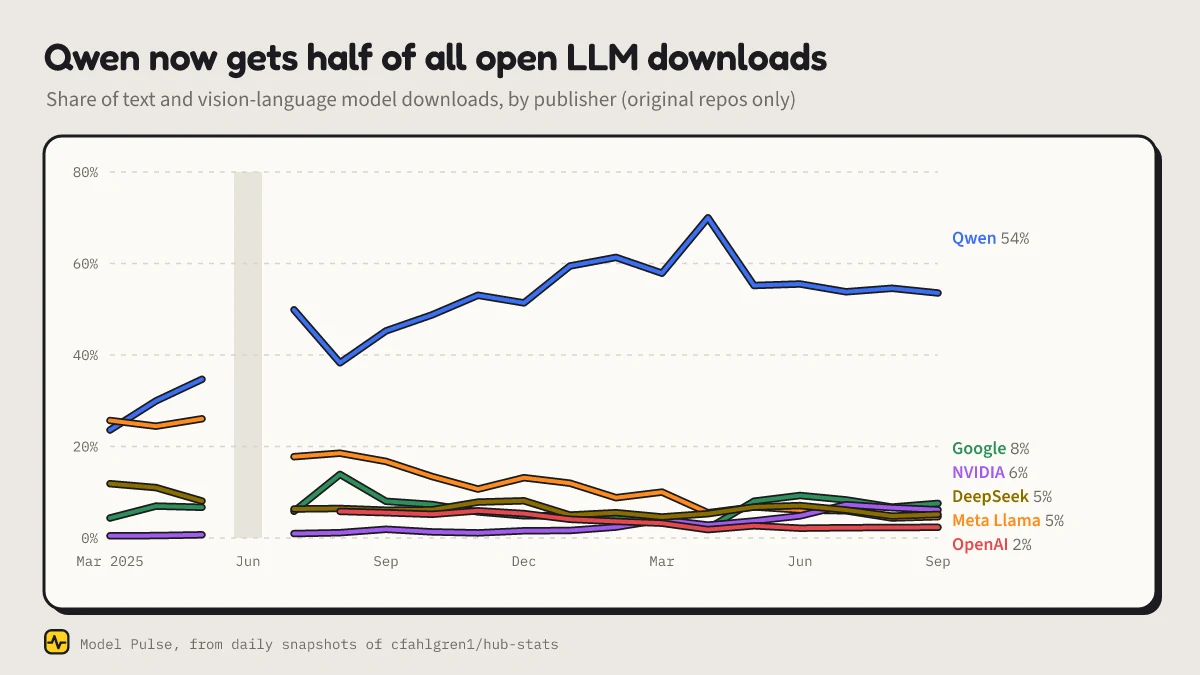
Count every download of a text-generation or vision-language model on the Hub, including every quantization and fine-tune, and ask who published the repo. In March 2025 Meta's meta-llama repos and Qwen's were roughly tied, at about a quarter each. Qwen pulled ahead in the spring of 2025 and kept going. By September 2026 Qwen's own repos took 54% and Meta's took 5%. NVIDIA is the riser to watch, from under 1% to 6%.
The most downloaded text and vision-language models in September 2026:
| Model | Downloads in September 2026 |
|---|---|
| Qwen/Qwen3-0.6B | 30.6M |
| Qwen/Qwen3-VL-8B-Instruct | 17.3M |
| openai-community/gpt2 | 16.2M |
| google/gemma-4-26B-A4B-it | 13.1M |
| Qwen/Qwen3-8B | 12.1M |
| trl-internal-testing/tiny-Qwen2ForCausalLM-2.5 | 11.7M |
| google/gemma-4-31B-it | 10.2M |
| Qwen/Qwen2.5-7B-Instruct | 10.0M |
| unsloth/Qwen3-Coder-30B-A3B-Instruct-GGUF | 10.0M |
| Qwen/Qwen3.5-9B | 9.8M |
Two of these are worth a second look. GPT-2, released in 2019, is still the third most downloaded text model. And a tiny test model used in TRL's CI makes the top ten, which shows how much of the Hub's traffic comes from automated pipelines.
4. Nearly half of all downloads go to derivatives
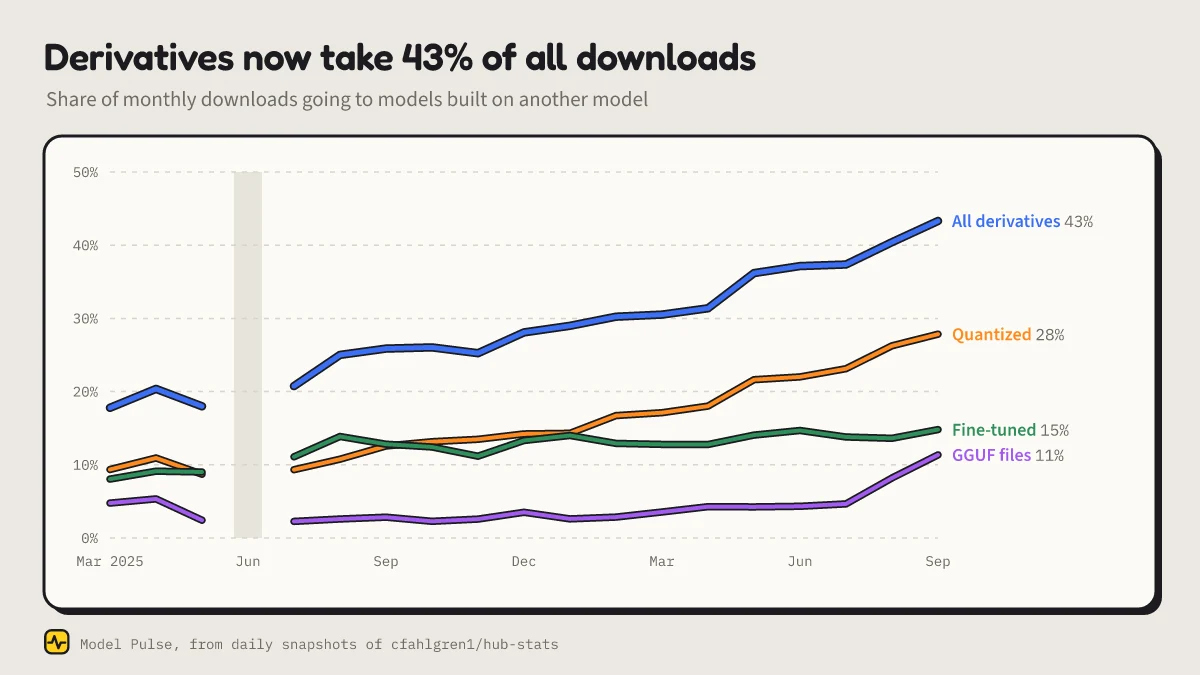
A derivative is a model whose card declares a base model: a quantization, a fine-tune, an adapter or a merge. In March 2025 derivatives took 18% of all downloads on the Hub. In September 2026 they took 43%. Quantizations drove most of it, going from 9% to 28%, and GGUF files alone went from 5% to 11%, most of that in the last three months.
Take Qwen3-8B. 6,283 models build on it, directly or through other derivatives, and 37% of its family's monthly downloads go to those derivatives rather than to the original. If you only look at the original repo, you miss more than a third of its reach.
Derivatives also reach scale faster. Of the models created since March 2025, 946 have passed one million downloads. Here is how long it took, by type:
| Type | Models past 1M downloads | Median days to 1M |
|---|---|---|
| Quantized | 297 | 100 |
| Adapter | 14 | 115 |
| Fine-tuned | 117 | 127 |
| Merge | 6 | 191 |
| Original (no declared base) | 512 | 331 |
5. The quantizers became some of the Hub's biggest publishers
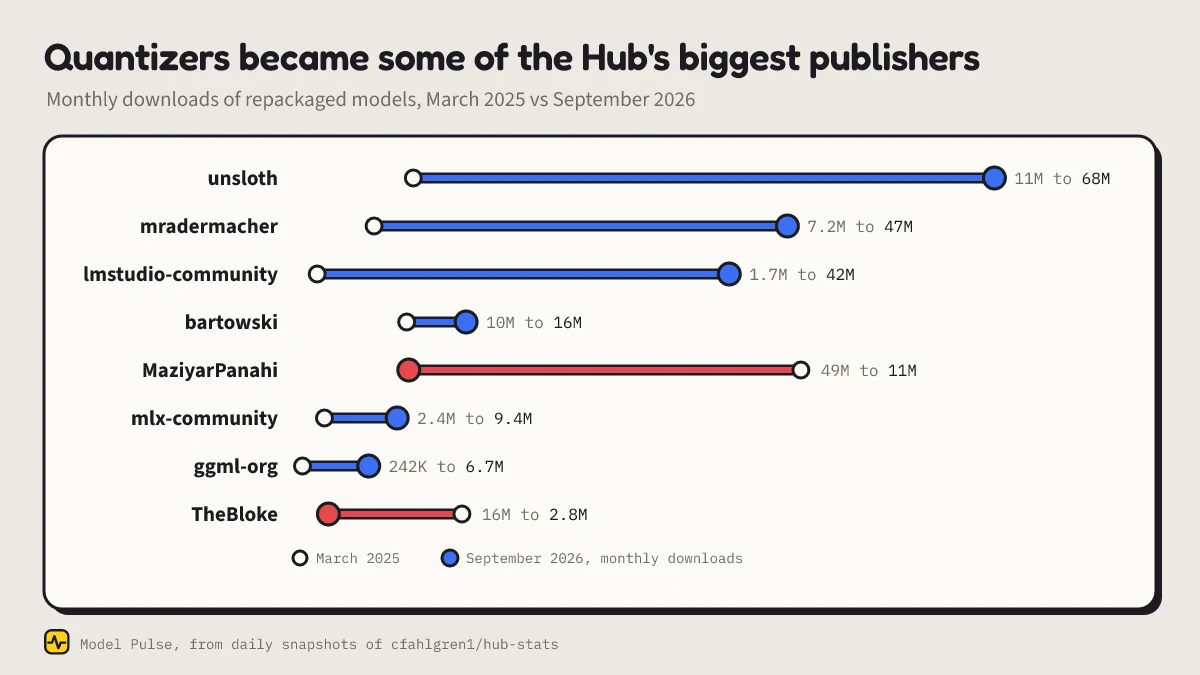
| Publisher | Monthly downloads, Mar 2025 | Monthly downloads, Sep 2026 | Repos with downloads, Sep 2026 |
|---|---|---|---|
| unsloth | 11.0M | 67.5M | 1,440 |
| mradermacher | 7.2M | 47.4M | 70,191 |
| lmstudio-community | 1.7M | 41.7M | 750 |
| bartowski | 10.4M | 16.2M | 2,318 |
| MaziyarPanahi | 48.7M | 10.6M | 2,790 |
| mlx-community | 2.4M | 9.4M | 5,431 |
| ggml-org | 0.2M | 6.7M | 193 |
| TheBloke | 15.7M | 2.8M | 3,655 |
Unsloth grew sixfold and now ranks among the top dozen publishers on the whole Hub. LM Studio's community org grew 24-fold. mradermacher runs at a different scale altogether: more than 70,000 repos got at least one download in September. TheBloke, who defined this category in 2023, is down to 2.8M a month as people move to newer models, and MaziyarPanahi went the other way too, from 48.7M to 10.6M.
6. The head of the Hub is losing its grip
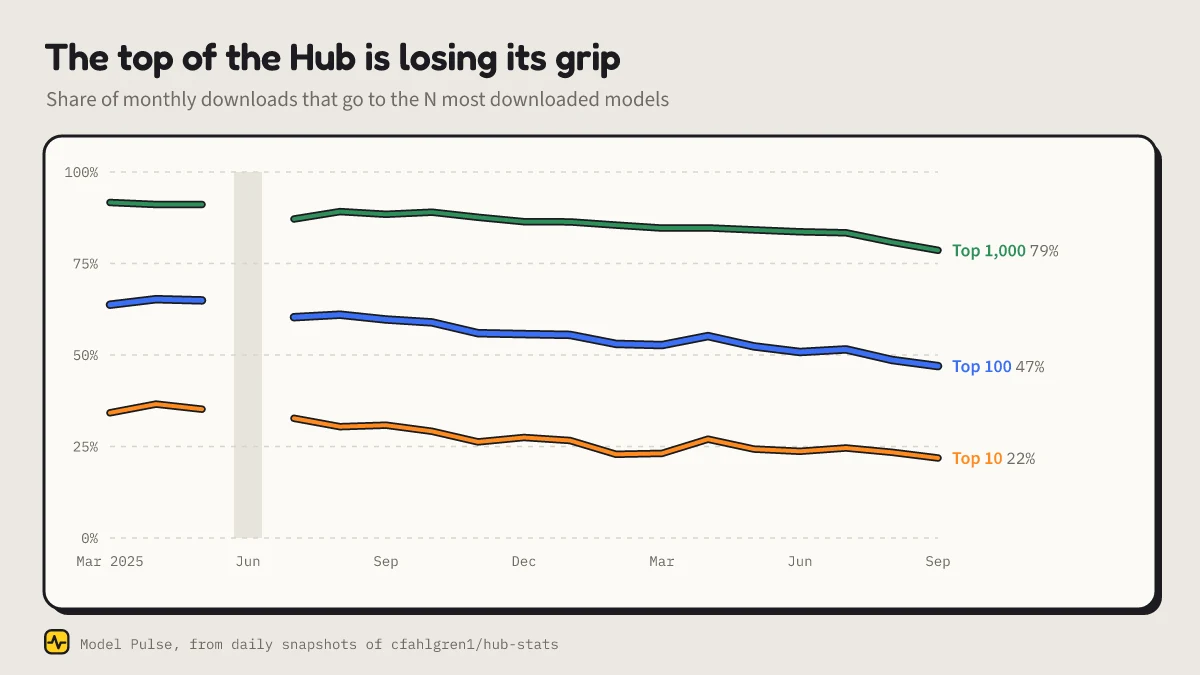
| Mar 2025 | Sep 2026 | |
|---|---|---|
| Share of downloads, top 10 models | 34.2% | 21.9% |
| Share of downloads, top 100 models | 63.8% | 47.0% |
| Share of downloads, top 1,000 models | 91.7% | 78.6% |
| Share of downloads, top 1% of models | 98.1% | 96.3% |
| Models with at least one download | 694K | 1.52M |
Demand is spreading out: the top ten lost a third of their share in eighteen months. The tail is still enormous, though. Of the 1.59M models tracked in September 2026, 45% got fewer than 10 downloads in the month and 88% got fewer than 100. Only 434 passed a million.
7. People download bigger models
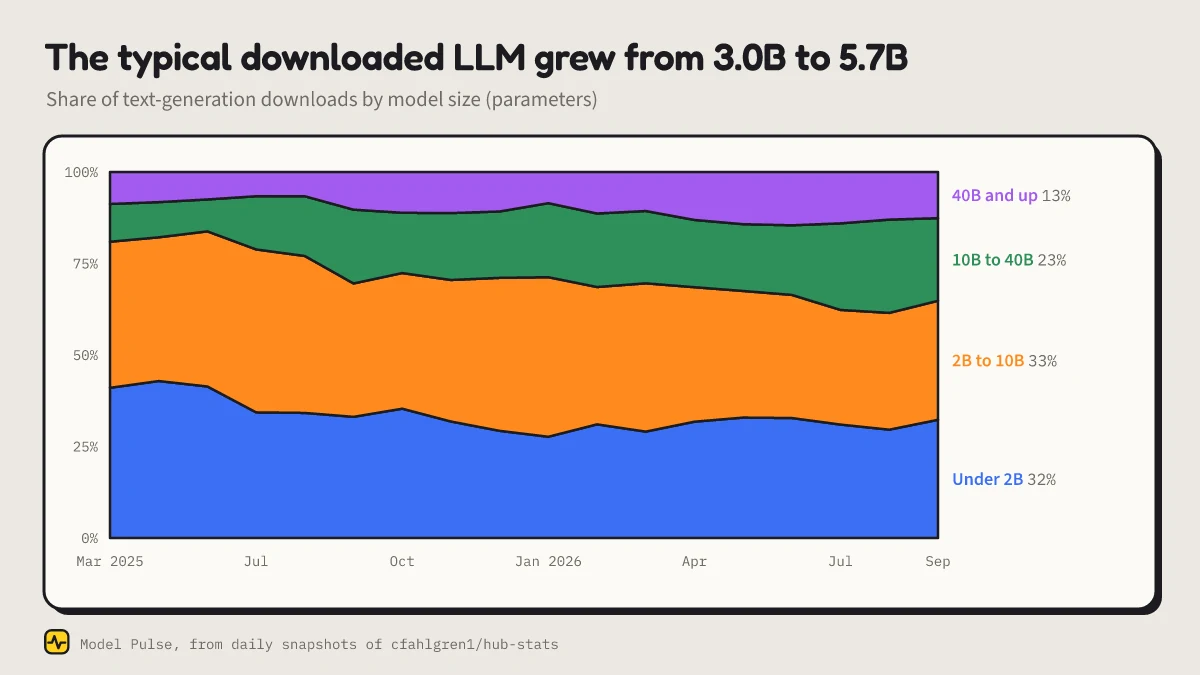
Weighted by downloads, the typical text-generation model went from 3.0B parameters in March 2025 to 5.7B in September 2026, peaking at 6.1B in June. Models with 10B or more parameters went from 19% of text-generation downloads to 35%. Small models haven't gone away: anything under 2B still takes about a third, some of it from CI pipelines that pull tiny test models all day.
8. Old models still carry a third of the Hub
The Hub dates every repo migrated from its early days to March 2022, so "2022 or earlier" covers BERT, GPT-2, T5 and the rest of that generation. Here is the share of each month's downloads by the year the model was created:
| Created | Share in Mar 2025 | Share in Sep 2026 |
|---|---|---|
| 2022 or earlier | 56.0% | 33.6% |
| 2023 | 17.6% | 11.4% |
| 2024 | 23.0% | 15.3% |
| 2025 | 3.5% | 17.9% |
| 2026 | 0.0% | 21.9% |
New models win share fast, since 2026 models already take more than a fifth of all downloads, but the old guard erodes slowly: a third of everything downloaded today is from 2022 or earlier.
9. A launch spikes for two weeks, then plateaus
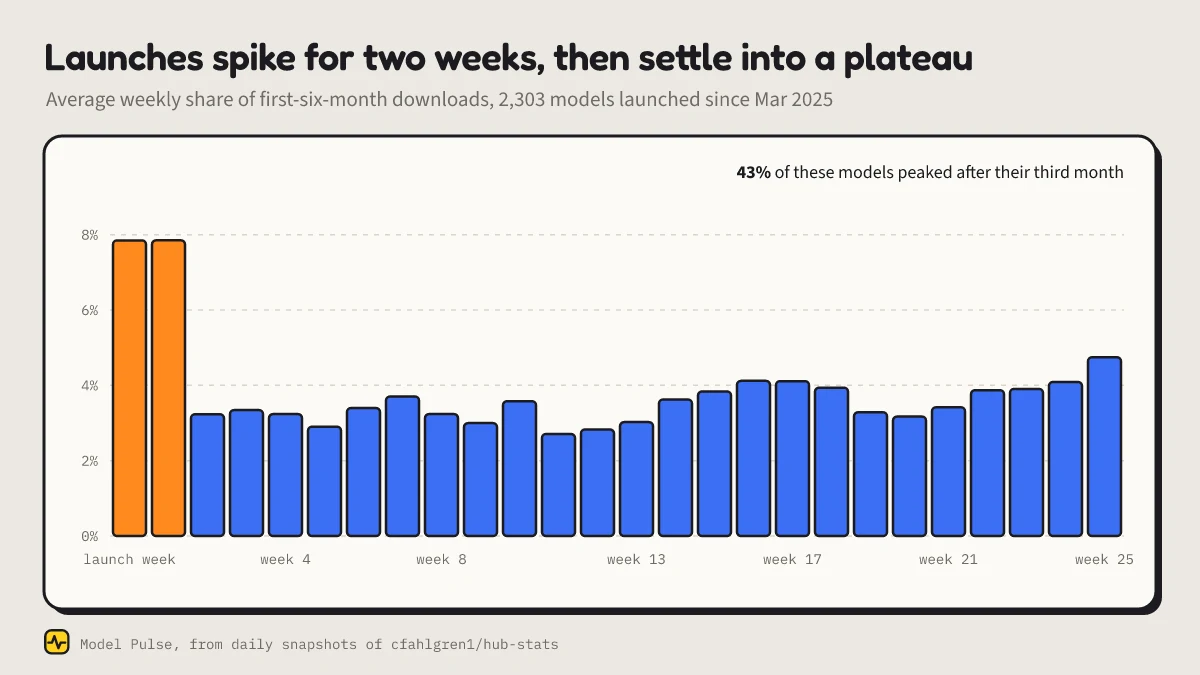
I took the 2,303 models launched between March 2025 and March 2026 that passed 100K downloads in their first six months, and looked at how those downloads were spread over the 26 weeks:
- On average the first two weeks take about 8% of the six months each. After that, downloads settle at around 3% a week and stay there; they don't fade.
- For the median model, the first month accounts for only 14% of the first six months.
- Only 8% of these models had their best week at launch. The median best week is week 10 after launch, and 43% peaked after their third month.
This is a set of models that succeeded, so it says nothing about the many launches that never take off. But for the ones that do, steady use matters more than the launch spike.
The fastest to a million downloads since March 2025:
| Model | Days to 1M downloads |
|---|---|
| openai/gpt-oss-20b | 5 |
| Comfy-Org/z_image_turbo | 5 |
| ornith-ai/Ornith-1.5-9B-GGUF | 6 |
| JonathanColetti/Qwen3.8-27B-Uncensored-GGUF | 7 |
| huihui-ai/Huihui-Qwen3.8-27B-abliterated-GGUF | 8 |
| lmstudio-community/Qwen3.8-27B-MLX-4bit | 8 |
| unsloth/Qwen3.8-27B-NVFP4 | 8 |
| Comfy-Org/Wan_2.2_ComfyUI_Repackaged | 9 |
| Qwen/Qwen3.6-35B-A3B | 10 |
A couple of niche repos also crossed a million in five days, most likely through automated pulls, and are left out of the table. Note how many community builds of Qwen3.8-27B made the list: when a popular model ships, the GGUF, MLX and abliterated variants race each other to the top.
10. Likes measure excitement, not use
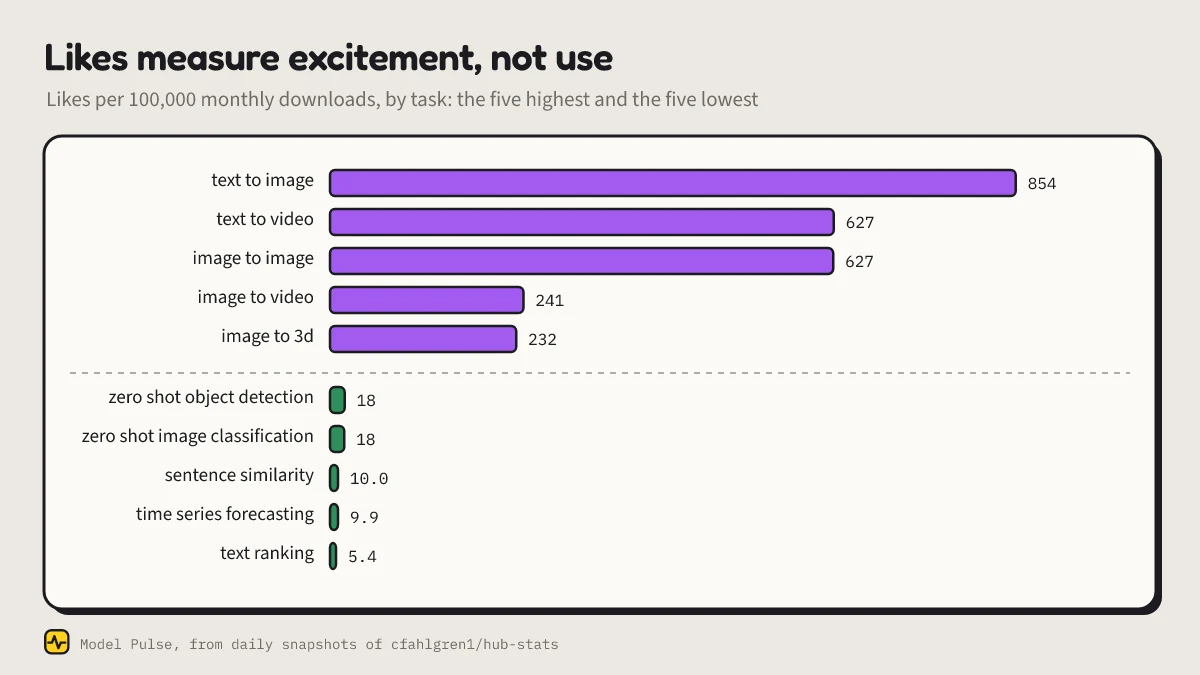
Across models with at least 1,000 monthly downloads, likes and downloads are only moderately related (Spearman 0.42). What a model is for matters more than how much it's used. Image generation models collect 854 likes per 100K monthly downloads; rerankers collect 5.
Some of the busiest models have almost no likes:
| Model | Downloads, last 30 days | Likes |
|---|---|---|
| mudler/locate-anything.cpp-gguf | 9.1M | 19 |
| amazon/chronos-bolt-small | 6.9M | 49 |
| cross-encoder/ms-marco-MiniLM-L4-v2 | 6.1M | 31 |
| autogluon/chronos-2-small | 4.5M | 8 |
And some of the most loved are rarely downloaded anymore:
| Model | Likes | Downloads, last 30 days |
|---|---|---|
| stabilityai/stable-diffusion-3-medium | 5,058 | 2,721 |
| WarriorMama777/OrangeMixs | 3,958 | 1,584 |
| prompthero/openjourney | 3,262 | 3,644 |
| zai-org/chatglm-6b | 2,915 | 2,881 |
If you rank models by likes, you're ranking them by how exciting they were. To see what people actually run, look at downloads over time.
How this was measured
Source. cfahlgren1/hub-stats publishes a fresh models.parquet with metadata for every public model on the Hub, usually daily. I read 681 of its historical revisions, from 2024-07-29 to 2026-10-02, keeping each model's 30-day downloads, all-time downloads and likes for each day. The latest snapshot adds the metadata: task, library, size, license and declared base models.
Daily downloads. The downloadsAllTime field exists from 2025-02-27. Daily downloads are the difference of that total between consecutive snapshots. Before that date only the rolling 30-day count exists, so Model Pulse shows that instead. Monthly figures in this post are the difference between month-end totals.
Which models. A model is tracked once it has 10 or more downloads in 30 days, 50 or more all-time downloads, or a like. That's 1.6M of the Hub's 3.1M models, and nearly all of its downloads.
Families. A family is a base model plus every model that declares it as a base, directly or through other derivatives, following base_model up to six levels.
Caveats. - Downloads follow the Hub's own counting rules, so they include CI jobs, benchmarks and other automated pulls. That's why tiny test models rank surprisingly high. - The source has gaps: two weeks in August 2024, most of June 2025, and parts of April to June 2026. Totals are unaffected, but daily values across a gap are averages. June 2025 is left out of the monthly line charts because its snapshot is incomplete. - The Hub sometimes books delayed downloads on a single day, which shows up as a short spike. - Publisher shares count downloads of an organization's own repos. A Qwen model quantized by Unsloth counts for Unsloth. - "Created" dates come from the Hub, which dates repos migrated from its early days to March 2022.
Explore it yourself
Every number above can be checked on Model Pulse:
- Open any model's daily and weekly history, with milestones such as the day it crossed a million downloads.
- Compare up to five models on one chart.
- See a model's family: how many quantizations, fine-tunes, adapters and merges build on it, and how many downloads they add up to.
- Browse the weekly rankings: most downloaded, fastest growing, new this month, most liked, biggest families and top organizations.
- Model authors can add a live badge to their model card.
The full dataset is open at modelpulse/model-pulse-data and updated every day, so you can run your own analyses.
What would you want to know about your own models? I'd love to hear it in the comments.
Made by Tardelli Stekel (stekel.ifsp.dev).